Chris LaBossiere · Public records and an industry perspective · 8 October 2026
The promise kept changing.
The landfill never went away.
Edmonton built its waste reputation on doing better than burying garbage. After decades of investment, failed projects and promises of excellence, residents deserve to know what that ambition actually bought.
I started on a recycling truck, collecting blue boxes. That work gave me a chance when I needed one. I eventually led Western Canadian operations for a major waste company. I know the work, and I’m proud of the people who do it.
I also watched the City expand its control of the waste business while presenting private haulers as an obstacle to its environmental ambitions. That was my experience of the relationship. The City would lead; the industry was expected to fit into its plan.
I asked AI to help trace the public record. The pattern I see is bigger than one failed plant: an urgent problem, a promise that more control and technology would solve it, then disappointing results and another investment. Landfill kept doing the work the system still needed.
The question is whether residents received enough environmental benefit and better service to justify the cost—and the competitive choice they lost.
The starting point · A landfill crisis
Clover Bar was filling up. That did not leave us only one answer.
I remember the urgency of the late 1980s and early 1990s. Clover Bar was running out of room. Finding somewhere else for Edmonton’s garbage was presented as a crisis. Aurum was the proposed replacement site, and it became a major political and legal fight.
The Aurum proposal dates to 1989–1990. In March 1990, a court quashed the rezoning bylaws after residents challenged the process. [40] [60] CBC’s archive catalogue also records Council voting to buy the site for $8.4 million. That is the reported purchase decision, not a calculation of the eventual loss. [61]
The failed search matters because it explains the pressure to find a different approach. But difficulty siting a City landfill is not the same as proving that regional landfill disposal is unavailable or uneconomic.
By April 2000, administration itself described ample local landfill space and relatively low disposal prices. It estimated large commercial haulers were paying $20–$30 per tonne at private sites, compared with the City’s $40 posted price. It also argued diversion had extended landfill life and would protect businesses from future price increases. Those were its contemporary assessments, not today’s prices. [62, p. 1]
Clover Bar ultimately closed in 2009. [3] That later date alone does not prove the original capacity concern was invented: recycling and changes in disposal destinations can extend a landfill’s life. What it does demand is a fresh comparison of the available choices as circumstances change.
Landfill remained part of the plan.
Edmonton secured disposal at Beaver Regional Landfill. Its financial statements record a term from 26 February 2007 to 26 February 2027, with a ten-year extension option, and at least 70,000 tonnes a year. [25] Beaver’s operator, now Claystone, is municipally controlled. [22]
The City had to replace Clover Bar. It still had a choice about how. Every expensive processing proposal should have had to beat the real alternatives on cost, environmental benefit and reliability. The urgency of the original problem could not justify every subsequent investment.
Before the plants · The customers
The City changed the rules. Private haulers lost contracts.
While Edmonton was pursuing a new waste system, it also changed who controlled the customers. Private companies already collected garbage from apartment and condominium buildings. Those were established businesses with customers, trucks and employees.
The court record is summarized in the published digest of WMI Waste Management of Canada Inc. v. Edmonton (City), 1996 ABCA 88, describes a 1995 amendment that gave the City responsibility for collecting and disposing of solid waste from multifamily residential units. It records that WMI’s customers terminated their private collection contracts after the change. WMI challenged the bylaw and argued that its business had effectively been expropriated. The appeal court rejected that argument. [53]
WMI sought permission to appeal to the Supreme Court of Canada. The Court dismissed that application, with costs, on 15 August 1996. It did not hear a full appeal on the merits. [54]
To me, that is where the accountability question begins. Customers were displaced through a change in municipal rules. What better service, lower cost or environmental result did residents receive in return? Winning the legal argument did not answer the value-for-money question.
Municipal control did not mean municipal employees emptied every bin. A City report in 2000 describes roughly 90,000 multifamily units served through bin contractors administered by the City. The important change was who controlled the service and the customer relationship. [62, p. 8]
Apartment residents deserve convenient recycling and food-scrap collection. The question is why delivering those services requires removing their choice of provider. Today’s City rollout promises food-scrap and recycling collection for all apartments and condos by the end of 2027. [63] Access to those services and proof of good value are both obligations—not interchangeable claims.
Start with the idea
The machinery was supposed to do the sorting for us.
Edmonton’s older residential system collected blue-bag recycling separately. Food scraps, however, stayed in the garbage. The system recovered organics from that mixed waste for composting with sewage-treatment biosolids. The blue bag had its own route; food scraps travelled with the garbage. [1]
That was the technological bet: recovering a valuable product from mixed garbage is a very different proposition from collecting clean material separately. The later audit describes efforts to improve compost quality and its marketability. [2] I want to know whether the extra machinery and complexity bought us enough benefit to justify their cost.
A decision with consequences
The $97 million composter failed financially. Then the building became unsafe.
The co-composter was supposed to turn food-containing garbage and sewage-treatment solids into compost. TransAlta built and initially operated the approximately $100 million plant under a 30-year agreement. The City committed waste and payments to the arrangement. [5]
In June 2001, Edmonton paid TransAlta $97 million to buy it. TransAlta’s stated reason for selling was a return to its electricity-generation business. [4] [5]
What residents were told the purchase would deliver.
A City waste-branch employee’s 2001 account forecast $140 million in savings against the original contract. It said ownership would retain compost revenue, remove minimum-tonnage payment obligations and advance the Centre of Excellence. It also described opportunities to sell the operation’s expertise abroad. [5]
“This risk no longer exists since the plant functions as intended.”
The City was presenting ownership as the next financial and environmental opportunity. The subsequent record shows the risks residents actually carried.
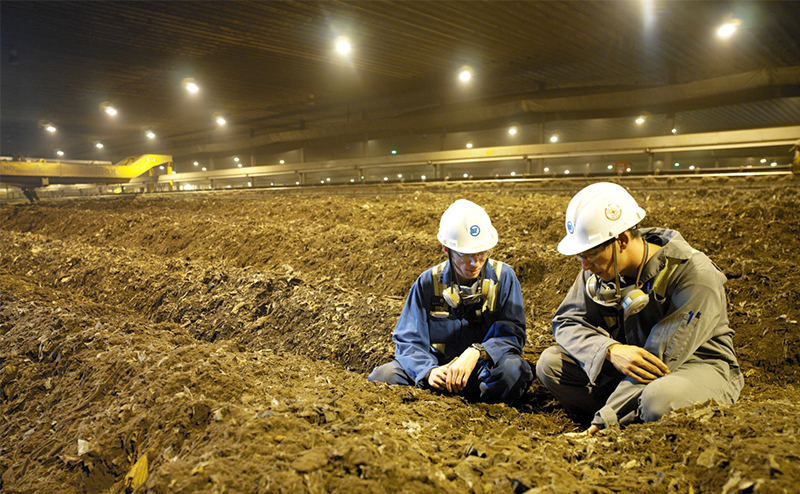
Then the financial expectations met the operating results.
| Composter economics | Original forecast | Then-current result |
|---|---|---|
| Operating expense | $9.5M | About $13M |
| Revenue | $5M | About $3M |
The audit’s updated valuation was below the purchase price. Management explored additional technologies and markets to improve the economics. The earlier review had considered the purchase reasonable under its assumptions; the financial targets remained unmet. [2]
That is the turning point for me. When the original economics disappoint, another promising technology is not a substitute for showing that the next decision makes sense.
The quality of what came out mattered.
This plant mixed organics recovered from household garbage with sewage-treatment biosolids. Anyone who worked a garbage route knew how variable the contents could be. My concern was the leap from that mixed material to a consistently valuable compost product.
The 2007 audit described sorting and retrofits to improve compost quality and marketability. It also recorded work to reduce humidity and corrosion. [2] The promise depended on finding a valuable use for the output, not simply putting tonnes through machinery.
What research establishes about contamination—and marketability
A University of Alberta study published in 2023 found elevated salts, cadmium, copper, lead and zinc in the Edmonton compost it tested, linked to its feedstock. The authors recommended chemical analysis or known feedstocks before use. They also found it useful for reclaiming hydrocarbon-contaminated soils, without a negative vegetation response to the salts and metals in that experiment. [31]
The distinction matters: a material suitable for a controlled reclamation project is not necessarily a saleable general-purpose compost.
The purchase agreement mattered when repairs arrived.
After the purchase, cracks in the composting equipment led to about $2.5 million in repairs. The City sued TransAlta. In 2008, the court upheld dismissal of the claim: the negotiated sale terms included as is, where is
, and the City had failed to give the required notice within the warranty period. The court found no evidence of deceit by TransAlta. [59]
These were equipment repairs, separate from the later unsafe building. The lesson is who carried the risk: once trouble arrived, the purchase agreement limited the City’s ability to recover its costs.
The building failed too. Residents still had the bill.
Investigations followed ceiling-panel irregularities. A further expert assessment advised allowing no accumulated snow on the roof. The aeration hall was closed for safety. [30, p. 59]
The audit identified gaps in maintenance oversight and serious structural problems. Closure meant extra hauling of compostable material to landfill. [6, p. 35]
The City determined it was unsafe to continue operating. Demolition was estimated at $12M. Equipment that was supposed to be salvaged later proved uneconomic to recover. [17, pp. 41–42]
The documented sequence is deterioration, safety closure, demolition and costs carried into future rates.
The 2021 filing scheduled these costs for recovery through utility rates. Closing the building did not erase the financial consequences.
| Item | Amount |
|---|---|
| Initial structure impairment and provision | 15.713 |
| 2019 equipment impairment | 5.015 |
| Additional demolition provision | 10.500 |
| Equipment later found uneconomic to salvage | 3.287 |
| Total additions | 34.515 |
The $12M demolition estimate includes $1.5M already provided in the initial entry. Impairments write down existing assets: adding these entries to the $97M purchase as an entirely new cash loss would double-count capital. This is also not today’s remaining balance.
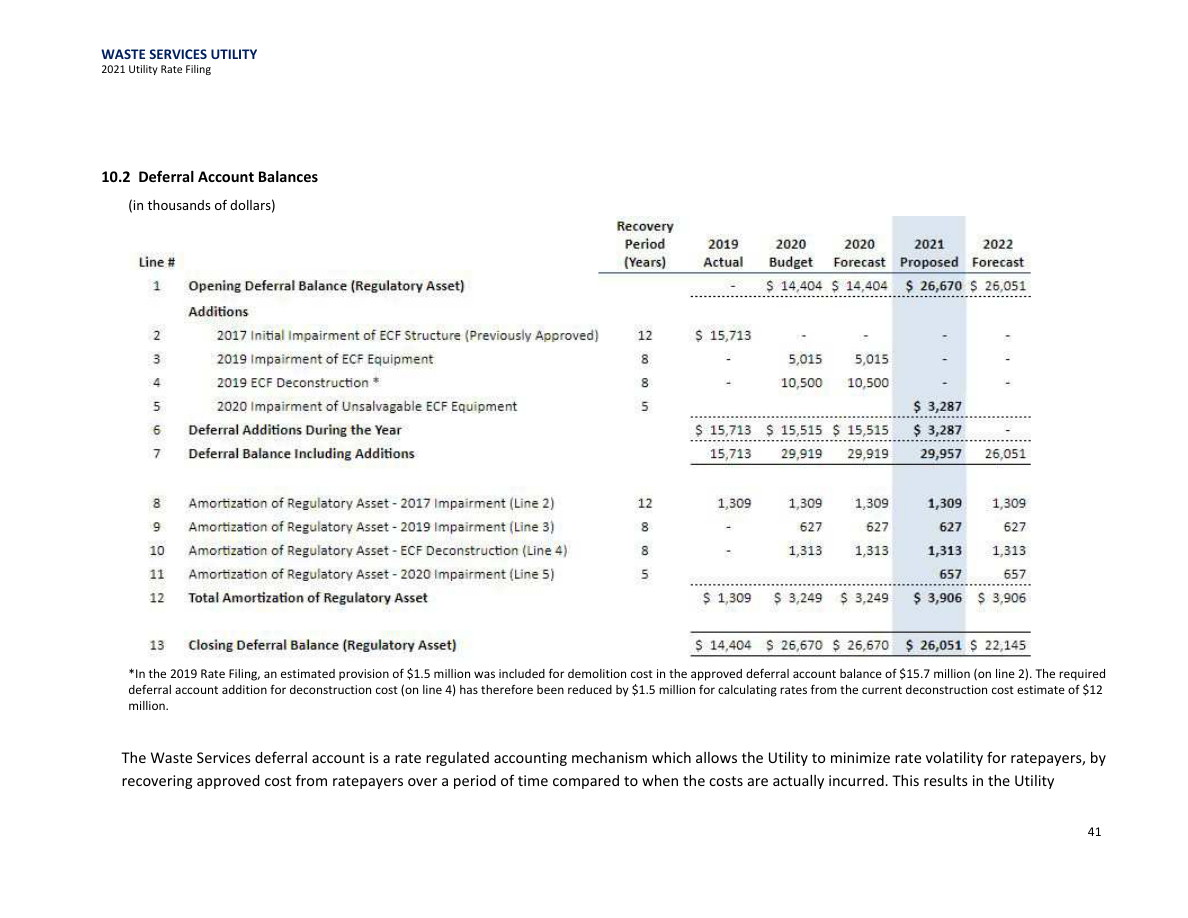
The 2026 filing still includes $3.25M in annual deferred-cost recovery. [13] Residents are paying for the aftermath as well as today’s service.
“The plant closed” leaves out the purchase, the disappointing economics, the product-quality problem, the unsafe building, the demolition and the bill carried forward.
Follow the commitments
The next project kept promising to close the gap.
The composter did not settle the problem. Fuel production, paper recycling, digestion and construction-waste processing followed as parts of a larger system. Each had a different job. Each needs to be judged on what it delivered, what it cost and what happened when expectations failed.
City purchase · composting
The co-composter
$97M purchase
A plant recovering organics from mixed waste. Serious structural problems led to shutdown in 2017; the City determined it was unsafe to continue operating in 2019. The 2021 filing scheduled roughly $34.5M of impairment and demolition items for recovery through rates. [6, p. 35] [17, pp. 41–42]
The deferred balance includes write-downs of existing capital as well as demolition; it is not an additional cash-loss total.
Publicly supported partner · fuel
Enerkem biofuels
$38.6M provincial grant
The concept was to convert prepared residual waste into fuel and chemicals. The grant went through the City to a private developer. In 2024 the City confirmed Enerkem had ceased operations, with higher processing costs for affected waste. [6, p. 24] [18]
Funding shown is the provincial grant routed through the City; total project investment was larger.
City-supported partner · paper
Greys Paper Recycling
$4.581M City capital identified
A paper-recycling venture at the waste centre. The City audit records this partial 2009–2010 capital amount. A corporate SEC filing confirms the operator’s January 2016 bankruptcy. [1, p. 4] [19]
The City capital amount is partial; a full recovery-and-loss account remains necessary.
City project · organics and biogas
The anaerobic digester
$41.68M project budget
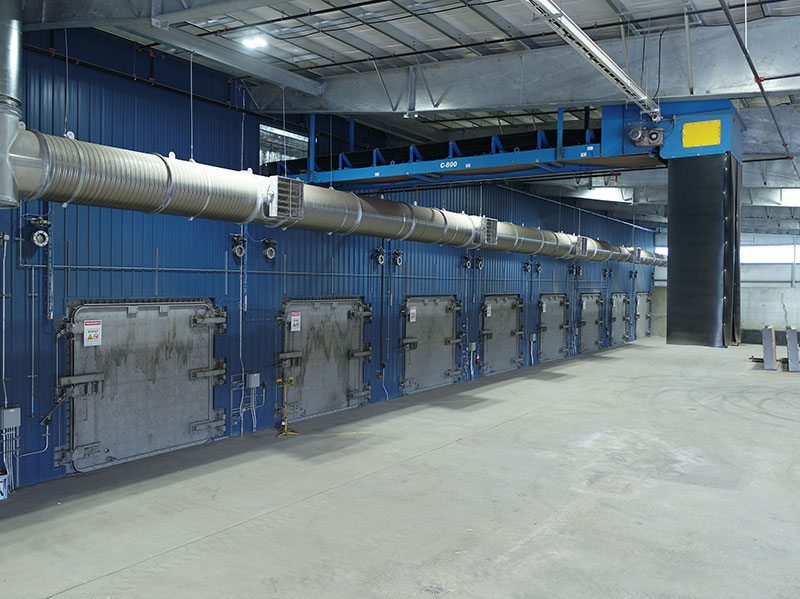
A separate facility using digestion to process organics. The City-authored report includes a $10M ERA grant in that budget and records processing in 2021–2022. In 2024 the City judged continued organics use unviable because of cost and complexity, while considering other uses. [3] [20]
Figure shown is the project budget. Final expenditure and the value of any repurposing belong in the final account.
City business · building-site waste
Construction and demolition recycling
$4.3M opening cost reported
The mixed-material facility opened in 2012. The City later withdrew from this business line; its 2021 rate filing says a third party took over in 2020, with royalties replacing direct operations. [44] [17, pp. 31–32, 44]
The City’s strategy reported $6.2M in cumulative non-regulated losses since 2012, including a $2.4M adjustment based on construction-and-demolition inventory value. Those figures cover a broader program; they are not a stand-alone loss for this facility. [46, p. 5]
The original capital-budget table identifies $4.3M financed through self-liquidating debentures—borrowing intended to be repaid from the service’s revenues. [47, p. 36] The inventory adjustment is a reduction in recorded value, not another construction bill.
In my experience, private businesses already offered construction-and-demolition processing in this market. I question why the City needed to invest in a competing operation. Council should show the capacity gap it identified, the market prices it compared, and the actual recovery and financial results it achieved.
The accountability question is what each commitment delivered, which assumptions failed and who carried the consequences. “Innovation” is a description of an approach. It is not an answer to those questions.
The bigger finding
The problem reached the decision-making itself.
The 2018 audit reviewed four project business cases. All four were insufficient in rigorously analysing viable options and demonstrating the preferred option’s advantage. Auditors warned Council might not have received complete, accurate information. [6, pp. 25–26]
“justify a decision already made”
That goes beyond equipment breaking down. It raises a question about how public money was committed in the first place. Did the City test the alternatives—or become invested in defending the system it wanted to build?
The same audit estimated that full-capacity biofuels operations would bring diversion to about 72%. It also put conversion at $127 per tonne versus $111 for landfill in 2017. These were historical comparisons and a projection, not achieved results. [6, p. 29]
The audit also found diversion reporting unreliable. Its words were Inaccurate measure results provide misleading information
. [6, pp. 8–11] For residents, that matters twice: to the case for investing and to the claim that the investment succeeded.
Read the headlines. Then read the accounts.
This is how the story was sold.
The public story remained ambitious as the financial and operating problems accumulated. These dated headline extracts link to the original coverage. Read the language used to describe the system, then compare it with the results.
26 July 2012 · Canada West Foundation
Written by Edmonton’s city manager
“Edmonton’s innovative approach turns waste into revenue”
Simon Farbrother described current household diversion of up to 60%, a 90% expectation by 2015, commercial collection, Greys, Enerkem and exporting expertise to China.
Read the City Manager’s article [35]4 June 2014 · Global News
“Edmonton first in world to turn trash into biofuel”
Read the original [36]12 May 2015 · Global News
“From poop to perfect compost: Edmonton’s world-class facility”
Read the original [37]1 February 2018 · Global News
“Edmonton’s long-praised waste management system struggling to divert 50% of residential garbage”
Read the original [38]28 December 2018 · Global News / 630 CHED
“Edmonton ditches its world-wide garbage management plan: ‘Some things shifted in China’”
Read the original [39]The 2012 article connects the whole argument. Edmonton’s most senior administrator was presenting processing, commercial expansion and expertise exports as parts of one revenue-producing model. That is the model whose results residents should be able to examine—not just one machine that eventually broke.
The public presentation · Images from the City’s own materials
Residents were invited to believe in this system.
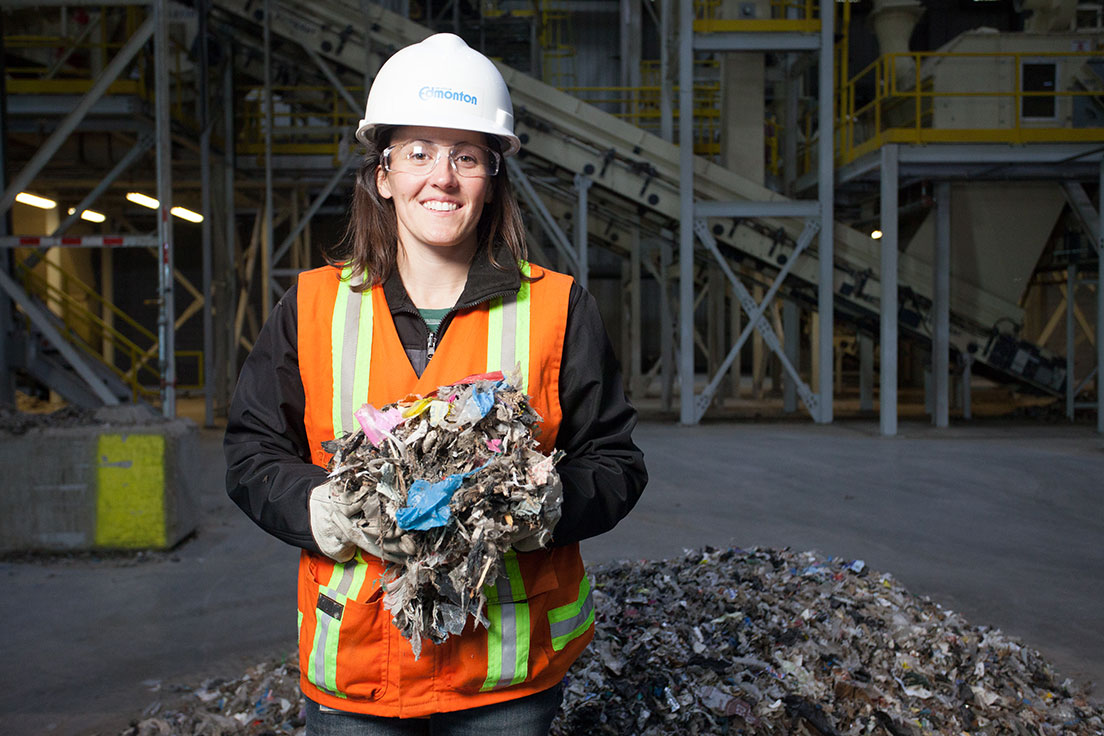
The story reached people through much more than council reports: school presentations, facility tours and Michael Recycle. The City’s 2015 photographic-tour document also described a teaching theatre, classrooms and meeting rooms. These were part of how Edmonton presented its waste system to the public. [73] [74] [75]

The same year’s public account
52%Reported residential diversion in 2015.
90%+The ambition promoted alongside a description of the system as world class. [7, p. 43]
A confident public identity was already established. The promised performance was still ahead.
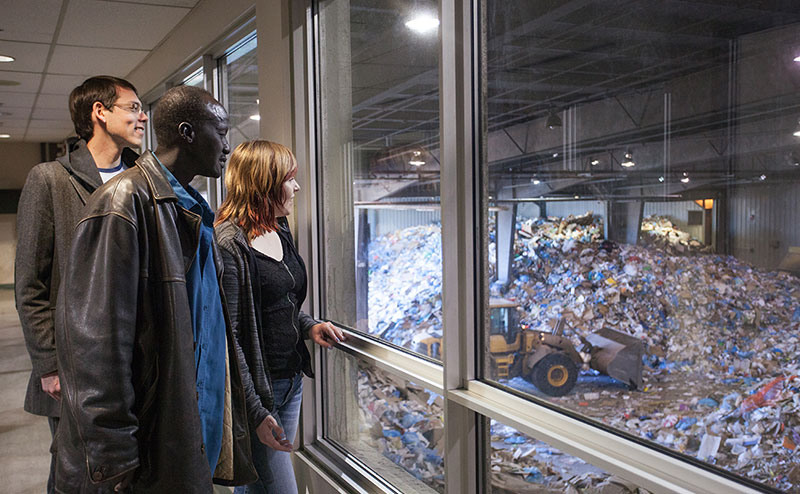

My criticism is of the institutional message. The people teaching children or showing visitors around were not responsible for proving the economics of every plant. Administration was responsible for ensuring that the reputation it promoted matched the results it could demonstrate.
To me, that public confidence made the gap more consequential. Residents were asked to believe they were participating in an exceptional system. They deserved an equally clear explanation when projects failed, material still went to landfill, and the costs continued.
The reputation outlasted the warning
We were still selling our expertise to the world.
The City audit questions residential diversion reporting. [1, p. 12]
The City calls the system world class
on the same page that reports 52% diversion and an ambition above 90%. The result and the promotional language appeared together. [7, p. 43]
A City release promotes a proposed project in Lichuan, China. City-owned Waste RE-solutions marketed Edmonton’s expertise internationally. [8]
The next major audit challenges the quality of the evidence behind performance and project decisions. [6]
The City’s own engagement report records residents’ belief in its advanced technology—and their dismay when that picture was challenged. [9, p. 3]
Waste RE-solutions becomes dormant. [10]
I don’t believe residents were given an honest picture of how well this system was working. The City kept promoting excellence while its own audits raised questions about the results and the decisions behind them.
The reputation was being marketed before the performance had earned it.
What “diversion” means
After the promises, landfill still carried the load.
Diversion is the share reported as kept out of landfill. A target is an intention. A reported rate is a result under a particular calculation. They are different things.
Published rates under changing methods and service arrangements, not a uniform trend series. Sources: City environmental reports, its 2020 diversion explanation, the 2024 collection audit and 2026 filing. [7] [11] [12] [13]
See the longer published record and comparison limits
| Year | Rate | Qualification / source |
|---|---|---|
| 2008 / 2009 / 2010 | 60% / 41% / 44% | Auditor recalculated 57% / 44% / 44%; differences ran both ways. [1] |
| 2014 / 2015 / 2017 | 51% / 52% / 44% | City environmental report. [14] |
| 2016 | 52% | Auditor found it unreliable and unsuitable for comparison. [6] |
| 2018 / 2019 | 36% / 21% | City’s 2020 explanation. [11] |
| 2020 / 2021 / 2022 / 2023 | 18% / 27% / 37% / 41% | 2024 collection audit. [12] |
| 2024 | 43% | 2026 utility filing. [13] |
Toronto reported 51.7% in 2024 and Halton over 58%. Housing mix and calculation rules differ, so a fair national ranking requires a common method. Edmonton’s shortfall against its own ambition is clear without one. [15] [16]
These results show that disposal remained essential. Recycling and composting did keep some material out of landfill, but the system never delivered the near-elimination of landfill use implied by a 90% ambition. When the composter’s hall closed, the 2018 audit specifically recorded additional hauling of compostable material to landfill. [6, p. 35]
Residents were paying for the processing ambition and for the disposal service still needed when it fell short. A plant receiving garbage is not the same as a system successfully recovering value from it.
Inside the system
What residents paid to build.
The large buildings in this historical aerial help explain the scale of the undertaking. The guide identifies their different jobs.
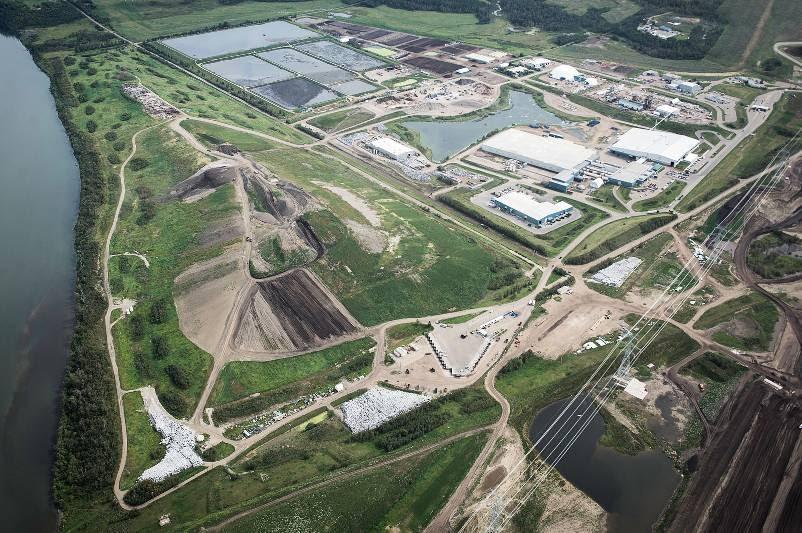
The mound in the foreground. The City’s project history records closure in 2009. Closure did not eliminate ongoing care and environmental obligations. [3]
The Materials Recovery Facility separates collected recyclables into material streams. This is distinct from recovering materials from mixed garbage. [6, p. 4]
The large central processing hall combined organics recovered from municipal waste with sewage biosolids. It closed permanently in 2019; the financial aftermath is documented below. [3]
The IPTF handled residential and commercial waste for processing and transfer. It also housed refuse-derived-fuel preparation. Its commercial role matters to the access dispute described below. [6, p. 4]
The rectangular basins stored and settled wastewater sludge. The City’s 2015 presentation identifies these separately from the landfill and composting buildings. [42]
Electronics recycling and construction-and-demolition processing are separate operations. Both appear in the City’s facility inventory. Their precise footprints are not pinned on this older photograph. [6, p. 4]
My connection to this site
As vice-president for Western Canada at Waste Management, I was responsible for the business operating the City’s blue-bag sorting plant under contract. I’m describing a system I worked in.
The City’s 2018 audit describes third-party operation of the blue-bag sorting plant. [6, p. 4]
A question from the sorting floor
Collected for recycling. But what happened next?
I started in recycling collection at BFI. I remember the practical problem behind the public promise: finding someone who could actually use what we collected. In my experience, markets for some mixed plastics failed to materialize. I recall hundreds of tonnes of accumulated material eventually being hauled to landfill.
I also remember large stockpiles of baled recycling at this site. The amber oval in the aerial marks the area I identify from memory. My recollection is that some material remained for years. The photograph locates the area; inventory records would establish the materials, dates and eventual destinations.
Residents did their part. They separated material, put it out and paid the bill. They deserve to know whether that effort ended in a new product, prolonged storage, fuel—or landfill.
Here is the challenge to the City.
- Identify the material stored in this area, its tonnage and the dates it arrived and left.
- Publish the inventory, shipment and disposal records: how much was sold, reprocessed, burned or landfilled, and at what cost?
- Explain whether stored material was counted as diverted, and how later disposal changed the reported result.
The inventory and shipment records should answer these questions.
A plastic number is not a promise of a buyer.
Today, even the City’s recycling guidance explains that a resin code does not determine acceptance: sorting, sale and transport to a buyer also matter. It says accepted materials have markets. [45] That makes the test straightforward: show the destination and outcome for each material, including mixed plastics.
The commercial business and the fight over access
The City chose to compete for commercial customers. The industry had to fight back.
The expansion did not stop at processing plants. It reached the customers private businesses served. This part is personal. I participated in the industry effort to challenge the City’s commercial waste business. Businesses came together, spent time and money, and repeatedly made the case in public. From my perspective, the eventual exit followed a fight the industry should not have had to fund.
Our objection was straightforward: the City used publicly financed infrastructure to offer a processing service that private competitors could not access on the same basis. I remember its combined garbage-and-recyclables offering being a powerful sales advantage with large food-service customers. We could compete on trucks, service and price. We could not reproduce access to a City-controlled system that was unavailable to us.
My concern was not simply losing a customer. It was competing with a public institution selling an environmental advantage—and then having to question whether that advantage was being delivered.
The contemporary record supports the access complaint.
The Edmonton Chamber’s August 2018 bulletin said commercial collection began in 2008, reported $6.2M in losses since 2012, and stated that private haulers could not access the waste centre’s processing facilities. It urged the City to work with industry. [29] This was a documented public dispute.
The City’s own subsequent strategy also reports $6.2M in cumulative losses since 2012 for the broader non-regulated program, including a construction-and-demolition inventory adjustment. This is not exclusively commercial-collection loss or a verified lifetime total. The $9.07M loan below overlaps this history and must not be added to it. [46, p. 5]
Commercial collection begins, according to the Chamber. The 2011 audit records a 2009 expansion business case and 62 new commercial accounts in 2010. [29] [1, pp. 25–26]
The audit found most business-case components present, but annual viability reviews missing. Management said haulers were moving waste to cheaper disposal options. [1]
The Chamber publicly challenges the losses and private haulers’ lack of processing access. [29]
The 2021 filing records $9.07M drawn by the end of 2019 to cover non-regulated business losses, and plans full commercial-collection wind-down in 2021. [17, pp. 40, 46]
In my view, commercial customers were not given an honest picture of the system’s effectiveness. That assessment comes from my experience; the linked records document the access dispute, financial problems and exit.
Public minutes also record C. LaBossiere, Alberta Waste Management Association, presenting and answering questions at Utility Committee on 25 June 2021, when the waste capital adjustment and multi-unit strategy were considered together. [33] That is one public record of my participation in the wider debate.
There is an earlier contrast in administration’s own record. Its 2000 report said the Mayor’s task force had recommended ending a City commercial waste-reduction advisory program in 1996 because private-sector recycling services were adequate. [62, p. 11] A later decision to compete for commercial customers deserved a clear explanation of what had changed.
The City was setting the rules and competing in the market.
Residents need to know who could use the infrastructure, on what terms, who received the revenues and where the costs landed. A private partner with preferential public support is not automatically evidence of open competition.
My experience with contract enforcement
Across decades of dealings with the waste branch, I encountered what I regarded as a real disdain for private haulers. I remember close truck supervision, detailed route requirements and substantial contractor penalties. I have not seen equivalent consequences applied to the City’s own crews.
That is my experience and assessment. The 2011 audit describes inspections of both City and contractor areas; it does not establish identical consequences. Current route-order clauses and monthly deductions still need the actual contracts and records. [1, p. 19]
Edmonton has used both models since 1989. Publish the comparison.
The 2024 auditor traced Council’s original decision to split collection approximately 50/50 between City staff and contractors to 1989. Management said it had periodically reviewed the arrangement, most recently in 2017. Yet the auditor found no documented support justifying the current division. [12, pp. 23–25]
That is more than three decades of experience with both models. Residents should be able to see what each delivers for the money. Publish an independently reviewed comparison adjusted for route density, travel distance, collection frequency and material collected.
Show stops and tonnes per paid crew-hour; truck utilization, downtime and replacement costs; missed pickups and verified destinations. Count wages, benefits, supervision, dispatch, maintenance, facilities, insurance, administration and corporate overhead on the City side. Compare those with the contractor’s full price plus the City’s retained oversight and transition costs. Show both the full economic cost and the costs that would actually disappear if work moved. An overhead allocation is not automatically a cash saving.
If City crews provide better value, that comparison should demonstrate it. If contractors do, residents deserve the benefit. A longstanding division of work should have to earn its place through results.
Apply the same service standards.
Compare cost per stop or tonne, missed collections, complaints, inspections and corrective action. Publish contractor deductions alongside the consequences of City service failures.
The 2024 audit found curbside collection effectively managed overall, while asking the City to demonstrate why its roughly half-City, half-contractor model provides best value. Management accepted a review with a December 2026 target. [12]
Today’s financial account
The old decisions are still part of today’s bill.
Residents pay for collection and processing today, but also for assets wearing out, interest on borrowing and costs carried forward from earlier decisions. A closed plant can disappear from the skyline long before its bill disappears.
The 2026 filing forecasts $250.19M revenue and $244.75M expense for the whole waste utility. Producer-responsibility funding belongs in that account. EPCOR supplies billing services; the City operates the waste utility. [13]
Where the money comes from
- Household fees
- $198.20M
- Producer responsibility
- $37.04M
- Other revenue
- $14.95M
- Total
- $250.19M
Where it goes
- Operating and maintenance
- $204.96M
- Depreciation · assets used up
- $30.48M
- Earlier costs recovered now
- $3.25M
- Interest
- $6.06M
- Total
- $244.75M
Forecasts, not year-end actuals. The $5.44M difference supports utility financing. New capital spending of $34.64M is separate; adding it to depreciation and debt principal would count capital more than once.
Personnel, contractors, support and billing
Spread across all 455,124 serviced homes, revenue is $45.81 and expense $44.81 per home monthly. These are mixed-service averages, not individual bills or allocated curbside costs.
| Personnel | $66.78M |
|---|---|
| External services | $91.70M |
| Fleet | $17.51M |
| Corporate shared services | $10.38M |
| Intra-municipal charges | $5.99M |
| Residual other costs | $12.60M |
Shared services plus EPCOR billing ($6.03M, included in external services) total $16.41M: 6.7% of expense. Personnel includes frontline workers; these records do not isolate every supervisor or establish all support costs as avoidable administration.
Put the service to a price test
My estimate is $25 a home, all in.
That is my conservative high-end estimate, grounded in industry experience, for three-stream collection including the contractor’s capital, processing and disposal. It is a fair-price estimate to test in procurement.
Estimated annual contractor price
City forecast fee revenue [13]
$57.18M annual gross price gap
This is the opening question, not a proven saving. The City’s total utility expense covers more services than this curbside estimate. We need an allocated curbside cost, actual competitive bids and a clear account of retained obligations and revenue changes. Existing debt and deferred losses do not disappear when a contract changes.
Producer funding should be included wherever it belongs in that comparison. A bidder’s price should also make clear who receives recyclable commodity revenue and who carries processing and market risk.
What actual private collection bids tell us: Toronto and Nanton
What actual bids tell us.
Toronto’s 2021 Etobicoke procurement, for service beginning in July 2023, gives us competing private bids for garbage, recycling, organics, bulky items and yard waste collection, transportation and off-loading. Dividing each annual bid by the reported 65,711 single-family households and 12 months produces this benchmark:
| Bidder | Annual bid | Per reported home / month |
|---|---|---|
| GFL · successful bidder | $10.44M | $13.23 |
| Emterra | $15.44M | $19.58 |
| Miller | $22.26M | $28.22 |
The contract also served other customer types, so these are normalized comparisons, not exact household bid rates. Disposal and processing are outside this collection comparison. These are historical bids, not current Edmonton offers. [55, pp. 1, 4–5]
There is an Alberta example too. Nanton’s 2024 audited statements disclose a private garbage-and-recycling collection contract at $5,429 a month plus $5.92 per household. At an illustrative 1,000 participating homes, that would be $11.35 per home monthly for two-stream collection. The household count is an assumption, not a verified Nanton service total. [56, note 18(iii)]
These bids give us a reason to test my $25 all-inclusive estimate seriously. They do not prove it is the upper limit: processing still has to be paid for, service requirements differ, and bids vary. That is what a properly specified competition would resolve.
A building’s bill should make sense against the service it needs.
My multifamily estimate is $7 per cubic yard collected, plus $50 a month for container service. Think of a six-yard bin as six yards of service each time it is emptied. A hypothetical 40-suite building with one six-yard garbage bin and one six-yard recycling bin would look like this:
| Pickups of each bin | Average yards / month | Building / month | Suite / month |
|---|---|---|---|
| Once weekly | 52 | $414 | $10.35 |
| Twice weekly | 104 | $778 | $19.45 |
| Three times weekly | 156 | $1,142 | $28.55 |
Calculation: combined bin capacity × weekly pickups × 52 ÷ 12 × $7, plus $50. This measures serviced container capacity, not tonnes or the amount actually filling each bin. Organics are outside this two-stream example.
Edmonton’s 2026 apartment and condo charge is $27.08 per dwelling, or $1,083.20 monthly for 40 suites. At once-weekly service, my model is $669.20 monthly below that bill—$8,030.40 annually. At three pickups a week, it is higher. The difference is a price comparison; organics and other retained services must be accounted for before calling it savings. [58]
Kamloops publishes a useful comparison: its 2026 multifamily tariff charges $100 monthly for a six-yard garbage bin with a weekly pickup, plus $50 for a six-yard recycling bin collected weekly. The combined published charge is $150. These are municipal customer charges, not private bids or evidence of the full economic cost. [57]
The important difference is how the bill relates to the work. Edmonton charges per dwelling. A volume-based price responds to bin capacity and pickup frequency. We need those building-level service records to calculate an honest citywide alternative—not an assumed “average apartment building”.
What could the curbside difference amount to?
For a household with Edmonton’s standard 240-litre garbage cart, the current $42.63 monthly rate is $17.63 above my $25 estimate: $211.56 a year per home, or $21.16 million per 100,000 homes. This standardized bill comparison is distinct from the total forecast-revenue comparison above. [58]
A procurement comparison must count the same services and revenues on both sides. Include producer funding and commodity proceeds; include contractor capital, processing and disposal; then identify which City costs actually disappear and which remain. Do not count existing capital twice by adding its full purchase price to annual depreciation.
The City has already identified a cheaper organics approach.
Its 2024 assessment compared 20-year costs: $261.91M for the status quo, $185.59M for its preferred outdoor-composting and interim-contractor approach, and $190.47M for the mostly contracted option. The preferred hybrid was $76.32M cheaper in present-value terms. [20]
Discounted costs over 20 years, not annual savings. This supports testing alternatives; it does not establish that handing everything to one provider is the cheapest answer.
A practical alternative · Buy the service, test the results
Toronto saved millions. Edmonton should make the market compete.
There is a more basic question beneath every new plant and business venture: why should residents risk their capital when experienced operators could compete to deliver the service? Years of running a municipal department do not automatically establish the commercial expertise to develop unfamiliar technologies or operate every business attached to them.
Toronto’s Auditor General identified this saving after District 2 curbside collection was contracted out. First-year savings, including one-time items, totalled $11.5 million. [69]
| Before contracting: annual cost including fleet reserve contribution | $30.5M |
|---|---|
| After contracting: recurring contractor cost | $19.0M |
| City contract monitoring | $0.7M |
| Recurring total | $19.7M |
| Recurring difference | $10.8M · about 35% |
This compares 2011 costs with the contract’s first year, August 2012–August 2013. The auditor also found the diversion target was achieved. The contract covered collection and delivery to City facilities; it was not an all-inclusive processing-and-disposal price. The 35% is calculated from the audit’s figures, not a forecast of Edmonton’s savings. [69, pp. 8–9, Exhibit 1]
Give entrepreneurs the opportunity to build.
The Toronto winner was GFL, founded by Patrick Dovigi in 2007. Its offering documents identify the Toronto award as a landmark contract in its development. By 2018, GFL announced a recapitalization implying an enterprise value of approximately $5.125 billion, with more than 5,000 employees. [71] [72]
I see an important Canadian entrepreneurial success story here: a city saved money while a young operator earned an opportunity to grow. Toronto was part of a much larger expansion involving acquisitions, financing and other customers. The lesson is that public procurement can create room for entrepreneurial value creation while delivering value to residents.
In my experience, operators competing across many markets develop skills in financing equipment, building efficient routes, maintaining fleets and adapting to changing disposal and commodity markets. A municipality should make those capabilities compete for its business. It should also keep that competition open to capable local firms, rather than replace its own monopoly with an unchallengeable private one.
My conclusion is straightforward: meaningful savings can coexist with environmental requirements. Edmonton should invite established national operators and capable local businesses to compete for clearly specified work. Structure the packages so that local firms can bid, compare full lifetime costs, and require credible plans for equipment, processing capacity, final destinations and service continuity.
Put the expertise and capital requirements into the bid. Where providers supply the trucks and facilities, their price should include them. Require enforceable performance security, independently checked outcomes and clear responsibility for overruns and failure. A private company’s name on a publicly guaranteed venture is a very different proposition from buying competitively priced service with meaningful risk borne by the supplier.
Contract management is real work. Toronto’s June 2026 audit called for stronger performance monitoring, enforceable accountability and payment controls. [70] That is where I want municipal expertise concentrated: defining the service, protecting residents and holding every provider to the same measurable standard.
In my view, Edmonton has repeatedly entered businesses it should have purchased services from. Before another investment, Council should require administration to prove why ownership is necessary, why the City has the expertise, and why competitive procurement cannot deliver better value. The burden of proof belongs with the proposal to risk more public money.
The commercial test
What the City spends and what the market would charge are different questions.
City accounts establish what the City reports. They do not automatically establish an efficient market price. My industry experience is the reason I want those numbers tested against real commercial alternatives.
My delivered-landfill benchmark is approximately $65 per tonne.
Based on my industry experience, I would test a competitive price of approximately $65 per tonne for transfer handling, trucking and landfill disposal combined. My working transport estimate is roughly $18–$24 per tonne, depending on payload density and trailer size. I recall disposal pricing around $25–$30 per tonne five or six years ago. The $65 is my present commercial estimate to test against bids; those component figures are not a verified current City invoice.
At 150,000 tonnes annually, $65 per tonne amounts to $9.75 million a year. An alternative costing $100 per tonne on the same fully delivered basis would be $5.25 million more each year, or $78.75 million over 15 years, before escalation or discounting. That is the scale of the question. Varme’s actual contracted price remains undisclosed in the records cited here.
Compare the same residual waste at the same starting point. This disposal benchmark does not include curbside collection or the separate recycling and organics services. It cannot simply be compared with the entire waste utility budget.
A public Ontario haulage benchmark
Toronto’s 2019 contract award for service starting in 2021 priced general transport at approximately $28.78 and $30.21 per tonne across its two contract areas. Including budgeted fuel and contingency allowances gives approximately $32.36 and $34.13. These are calculated from the published first-year prices and estimated tonnages, not actual invoices. The procurement used 38-tonne loads for diesel/dual-fuel trucks and 28-tonne loads for CNG trucks. It covered hauling from transfer stations to Green Lane and alternate landfills, not transfer-station operations or landfill disposal. Different routes and dates prevent treating these as Edmonton quotes. [77, pp. 2–5]
A posted gate fee is an asking price for a particular service. Actual average revenue depends on customer contracts, material types and the volumes handled. Profit then depends on the full costs. Comparing a public gate price with a negotiated landfill fee while leaving out transfer and transport can produce a misleading result.
Follow the tonnes as well as the money.
If the realized fee for accepting a tonne exceeds the incremental cost of transferring and landfilling it, that tonne contributes revenue toward the system’s remaining costs. That financial incentive can exist even when the processing system is falling short. Whether it produced a surplus in Edmonton requires actual receipts and costs, not a posted gate fee alone.
The older Beaver agreement’s 70,000-tonne annual minimum was a contractual floor, not a measure of actual shipments. [25] The 2018 audit documents additional landfilling after the composting hall closed. [6, p. 35] To establish the full pattern, Council should publish annual weighbridge tonnes by destination, direct-to-landfill bypasses, processing rejects, plant downtime, revenues and delivered disposal costs. Separate residential from commercial loads and reconcile stockpile changes. The City’s material-movement dashboard is a starting point for that examination. [78]
My concern is that a favourable-looking financial presentation can be mistaken for commercial competitiveness. Show us the realized revenue, the costs allocated to that activity and the alternatives available at the time. Waste diversion and financial performance each need their own evidence.
The next commitment · Varme waste-to-energy
Fifteen years of garbage is a major financial commitment. Show us the price.
This is where the history becomes a current decision. A new private plant can still depend on a long public commitment. After the co-composter, the question is what Edmonton is promising to pay—and which risks remain with residents if the expected performance does not arrive.
After the composter, the biofuels venture and the organics review, Edmonton has chosen another long-term processing arrangement. The City says its agreement with Varme covers up to 150,000 tonnes of residual residential garbage each year. The January 2024 announcement described a 15-year term and a facility roughly 40 kilometres northeast of Edmonton. The plant would burn garbage to generate electricity, with carbon capture. [23] [24]
At 150,000 tonnes every year, that is 2.25 million tonnes over the term. The public volume statement is not the minimum-payment clause: residents still need to see what Edmonton must deliver or pay for, including when waste reduction leaves less garbage.
Small differences per tonne become enormous commitments.
Based on my industry experience, I expect a processing price above $100 per tonne and believe negotiated landfill disposal could be substantially cheaper. That is my price assessment. The signed Varme fee and a comparable current Beaver bid were not available in the public records reviewed.
Calculated at 150,000 tonnes annually. A recurring price premium deserves the same scrutiny as a major capital project.
| Assumed fee | Annual payment | 15-year total |
|---|---|---|
| $50 / tonne | $7.5M | $112.5M |
| $100 / tonne | $15M | $225M |
| $125 / tonne | $18.75M | $281.25M |
| $150 / tonne | $22.5M | $337.5M |
Scenarios, not disclosed bids. Totals are undiscounted, exclude inflation and escalation, and exclude transfer, transport and retained obligations. The $50 case illustrates the proposed half-price comparison; it is not an authenticated Beaver offer.
If processing cost $100 and equivalent landfill disposal cost $50, the fee premium would be $7.5 million a year, or $112.5 million over 15 years, before differences in logistics. Even a $20 premium means $45 million over the term. If the City is buying environmental benefits with that premium, tell residents the price and the benefit purchased.
The engineering changed. Did our deal change with it?
Emissions Reduction Alberta’s project summary says the waste’s energy content was lower than expected and the energy needed for carbon capture had been underestimated. These findings required a 25% increase in facility scale and changes to the commercial model. ERA reports approximately $2.8 million in study funding. [48]
Varme’s project page now describes a 205,000-tonne annual facility, under development, with a final investment decision anticipated in 2026. That is a plant design figure; the City’s published supply figure remains up to 150,000 tonnes. [49] Council should explain whether the redesign changed Edmonton’s price, waste specification, volume obligation or exposure to delay. A larger plant does not automatically mean a larger City guarantee.
Trucking belongs in the comparison—and the published route is shorter.
Edmonton already consolidates residual garbage into long-haul trucks for Beaver Regional Landfill near Ryley. [27] Varme’s engineering report compares a 180-kilometre round trip to Ryley with 90 kilometres to the proposed plant. It therefore projects lower hauling emissions. The same report says the detailed emissions-reduction calculations were being developed separately. [50, pp. 5–6, 11]
A shorter route reduces the travelling portion of the cost; it does not halve transfer handling or the disposal fee. The question is how much it saves per delivered tonne against any processing premium. Publish the actual routes, payloads, loading costs, fuel use, return trips and disposal of ash and other residues. Compare both options from the same transfer point, including any new infrastructure and backup disposal during shutdowns.
For illustration, saving one truck-hour at an assumed $200 per hour saves $8 per tonne with a 25-tonne payload, or $5.26 with 38 tonnes. Those are sensitivity assumptions, not measured route savings or a quoted trucking rate. Payload, loading and queue time, return travel and the ability to complete another trip determine the actual saving.
For scale, an illustrative 25-tonne payload means 6,000 loaded deliveries a year at 150,000 tonnes. Applying the report’s distances gives 540,000 truck-kilometres to the plant versus 1.08 million to Ryley. Those are scenario calculations, not a fleet forecast; actual payloads, routes and additional movements determine the outcome.
Beaver is an existing commercial alternative. Where is the comparison?
Claystone’s business plan identifies Edmonton as its largest customer, describes its long-haul service, and proposes bundling transport in 53-foot walking-floor trailers with disposal. [51] Its 2022 announcement also confirms that it won Strathcona County’s waste contract through a competitive RFP. [52] There is an established regional procurement market to test against.
The records located establish those services and procurement history, but do not disclose a current Edmonton-specific disposal bid. The comparison Council should publish is the actual Beaver offer and other compliant alternatives, including negotiated fees, escalation, hauling, environmental performance and remaining commitments. Edmonton’s older Beaver agreement included a 70,000-tonne annual minimum and an extension option beyond February 2027. Its current status matters to this calculation. [25]
Public support is already part of the economics.
The federal announcement describes a Canada Growth Fund arrangement to buy up to 200,000 tonnes of carbon credits annually for 15 years, starting at $85 per tonne with escalation. [28] At the maximum volume and initial price, that is $17 million annually, or $255 million over 15 years before escalation. These are conditional purchases of carbon credits, separate from Edmonton’s waste-disposal bill.
My concern is that residents could also be supporting the project through a long-term disposal premium. Public ownership of the plant is not required for the public to carry substantial risk. If Edmonton pays more than a competitive alternative, Council should explain what additional service or environmental benefit justifies that difference.
Commercial haulers need a reason to switch. Who pays if they do not?
In my experience, commercial haulers do not voluntarily trade a cheaper, reliable disposal arrangement for a more expensive one. They compare the full delivered cost, including their routes, transfer facilities and existing contractual obligations. A shorter haul or another commercial benefit could change that calculation. A green label alone will not.
That is why I am skeptical that this plant will attract additional commercial waste at a premium. Edmonton can commit its own residual waste; it cannot commit waste controlled by private haulers or other municipalities. The revised plant design is 55,000 tonnes a year larger than the City’s published maximum supply. Council should identify who supplies that balance and whether Edmonton carries any financial exposure if those volumes do not arrive.
If Edmonton guarantees a price above a competitive alternative to make this project viable, I regard that premium as a subsidy. I am concerned this could become another project whose economics disappoint after the public commitment has been made. The test is the contract: are payments tied only to tonnes accepted, is there a minimum annual bill, and can costs or shortfalls be passed back to the City?
A put-or-pay clause would mean paying for some contracted capacity even when the waste is not delivered. Its existence and terms have not been disclosed in the records reviewed. That is precisely why residents need the agreement and amendments: to see the maximum annual exposure, escalation, backup-disposal costs and exit liabilities before calling the risk private.
The documents residents should be able to examine
- The contract and amendments: price, escalation, minimum tonnage, shortfall payments, waste-quality requirements and termination rights.
- The evaluated alternatives: actual landfill and processing bids, transfer and hauling costs, and the treatment of existing Beaver obligations.
- The revised business case: the financial effect of the larger plant and changed commercial model, including who bears construction delays and operating failures.
- The full environmental comparison: trucking and transfer emissions, combustion, carbon-capture energy use and uptime, ash disposal, and the actual landfill methane-management baseline. Report energy recovery separately from recycling and composting.
I am not satisfied with a diversion announcement as the explanation for a 15-year decision. Show the alternatives, the premium, the environmental benefit and the risk residents retain. Then we can judge whether this is good procurement or an expensive way to buy another promise.
Beyond waste · The same test for another big promise
Blatchford raises the same question.
This concern extends beyond garbage. At Blatchford, Edmonton became the land developer for a neighbourhood intended to demonstrate a greener way to live. Its energy utility says it wants to “inspire cities around the world to follow our lead.” That ambition sounds familiar. [64]
The City’s 2024 audit recorded a $632-million approved redevelopment capital budget. That is the overall development budget, intended to be recovered through land sales—not a $632-million loss or a measure of the extra cost of environmental requirements. But the business assumptions matter precisely because the City is relying on future buyers to make the numbers work. [65, pp. 9, 13–14]
The auditor found unsupported assumptions about annual land sales and land appreciation, and reliance on an appraisal last performed in 2017. The forecast for completing City land sales had moved from 2038 to 2042. The audit also found no effective overall system for tracking progress against all the development’s goals. Those are basic management questions for a City taking on the role of developer. [65, pp. 3, 13–14]
There is real construction: the City reported nearly 400 homes completed or under construction at the end of 2025. It also stated that neither the redevelopment nor its energy system received direct tax levy support. The question is whether the financial model can deliver the promised community at the promised cost. [66]
The energy system makes that question concrete. Taproot reported in February 2026 that its original business case required a $98-million non-refundable cash contribution because customer fees would not cover its costs. The reported requirement was then about $69 million, after changes including a federal grant. These are successive estimates of a funding requirement, not two losses to add together. Expected grants were central to the plan. [67]
For 2026, Council froze utility rates while administration reviewed the financial sustainability of its pricing model following federal policy changes. The model aims to keep Blatchford residents’ bills comparable to those elsewhere in Edmonton. Promising competitive customer bills does not, by itself, make the underlying infrastructure competitive. [68]
To me, Blatchford and Varme raise the same challenge for Council: first justify risking public capital or making long-term financial guarantees at all, then test the commercial assumptions as hard as the environmental promise. Who buys the service? What will they actually pay? What happens when demand, grants or policy change? And who covers the difference? I want Edmonton to pursue better environmental results with business cases that survive those questions. An inspiring vision should make the scrutiny more demanding.
What this history should change
Make the next promise earn our confidence.
I started this work believing recycling could make a difference. I still do. That belief is why I care whether the material finds a market, whether a plant works, and whether residents receive value for what they pay.
The City took greater control of collection, invested heavily in processing and sold a reputation for excellence. The public record contains failed ventures, weak business cases, missed targets and bills that outlasted the facilities. Through it all, landfill remained necessary.
My conclusion is that Edmonton became too invested in expanding and defending its own system. The next technology was too often asked to rescue the promise of the last one. Residents should not have to finance that pattern indefinitely.
The first decision is whether the City should be in that business.
Given this record, I want Council to demand evidence of the expertise and advantage that justify putting residents’ money at risk. Competitive contracts with experienced operators should be the benchmark against which further municipal ownership or financial guarantees must prove their worth.
Before the next long-term commitment, publish one independently checked comparison: what the service costs today; what qualified providers will charge for the same work; how much material reaches a verified final use; and the maximum cost to residents if the plan fails. Include capital, producer funding, hauling, processing and disposal. Apply the same service standards to City crews and contractors.
Apartment residents deserve recycling and food-scrap service. Everyone deserves reliable collection. Those goals should make us demand better procurement and clearer results—not accept every project presented in their name.
For me, this record has exhausted the credibility of another assurance that the next green project will work as planned. Council should require independently tested costs, outcomes and financial exposure before committing more public money. Confidence must be earned through delivery.
“World-class” should be a conclusion the evidence supports. It should never be the reason to stop asking questions.
Check the records yourself
The sources behind this examination.
I encourage any Edmontonian to dig into these links and follow the story. Read the original reports, test the arithmetic and ask for the missing records. Page numbers refer to printed pages where available. My experience and estimates are identified in the text; the documentary evidence is linked below.
- 2011 Waste Management Services AuditCapital p. 4; diversion p. 12; collection inspections p. 19; commercial cases pp. 25–26.
- 2007 Edmonton Composting Facility Follow-upPurchase and valuation pp. 1–3; compost quality and proposed improvements pp. 2–5. The PDF cover dates the report 8 January 2007.
- City-authored anaerobic digestion final outcomes reportProject budget and operation in 2021–2022; source photograph, Figure 2.1.
- TransAlta annual information formSale in June 2001 for $97M; listed shares under “Market for Securities”.
- City of Edmonton Buys MSW Composting FacilityBioCycle, September 2001, pp. 23–24. Author Garry Spotowski identified as a City Waste Management Branch employee. Contemporary City rationale and operating account.
- 2018 Waste Services AuditDiversion pp. 8–11; grant p. 24; four business cases pp. 25–26; biofuels expectations p. 29; composter structure p. 35; capital p. 46.
- Report on the Environment 2015Page 43: world-class description, 52% result and 90% ambition together.
- City release: Edmonton’s waste expertise goes internationalJanuary 2016. Proposed Lichuan project; Waste RE-solutions company operational in 2014, not the proposed plant.
- Waste Services What We Heard, spring 2019Page 3. Qualitative engagement summary, not a representative opinion poll.
- City 2021 annual financial statementsSearch “Waste RE-solutions” for dormancy from June 2021.
- City explanation: How the waste diversion rate shapes the future6 May 2020; 2018 and 2019 results.
- 2024 Waste Collections Audit2020–2023 diversion; effective curbside management; best-value review of delivery mix.
- 2026 Waste Services Utility Rate FilingCurbside homes p. 10; financial totals and fees p. 39; expenditure and capital schedules. Forecasts, not actuals.
- Report on the Environment 2017Published 2014, 2015 and 2017 residential diversion.
- Toronto Solid Waste Reports2024 combined residential diversion: 51.7%.
- Halton’s 2024 waste diversion milestonePublished diversion above 58%; not recalculated to Edmonton’s methodology.
- 2021 Waste Services Utility Rate FilingNon-regulated loan p. 40; composter deferrals pp. 41–42; commercial exit p. 46.
- City 2024 supplementary operating budget updateSearch “Enerkem”: shutdown, service-agreement savings and increased processing costs.
- Emperor Paper corporate SEC filingDirector’s Greys history and January 2016 bankruptcy. Corporate assertions of causation are attributed, not independently adopted.
- CO02411: Organics Processing Program Path Forward3 September 2024. Digester assessment and discounted 20-year options.
- 2009 Transportation & Public Works Committee budget questionsSearch “30-year contract”: Clover Bar capacity, Beaver Regional and West Edmonton disposal arrangements.
- Claystone: Beaver Regional Landfill brochure1992 opening, regional Class II facility and municipally controlled ownership. Does not establish a 200-year remaining life.
- City of Edmonton: Waste-to-EnergyCity description of up to 150,000 tonnes of residual residential waste annually.
- City and Varme joint announcement, January 202415-year period, approximately 40 km northeast location, planned energy recovery and carbon capture. An announcement, not the full executed contract or proof of achieved performance.
- City of Edmonton 2015 financial annual reportFinancial statements, landfill note: 2007–2027 term, ten-year extension option and 70,000-tonne annual minimum. Historical terms, not proof that no subsequent amendments exist.
- Beaver Regional board package, 31 August 2020PDF page 50, Schedule B, Retained Contracts: October 2006 City agreement and separate October 2019 hauling agreement.
- City: What Happens to Garbage, Recycling and Organics?Residual garbage loaded into long-haul trucks for Beaver Regional Landfill.
- Finance Canada: Canada Growth Fund’s fourth investment11 June 2024. Federal carbon-credit purchase arrangement: up to 200,000 tonnes annually, 15 years, initial $85 per tonne plus escalation. This release also gives a City waste figure of 200,000 tonnes; this examination uses the City’s own up-to-150,000-tonne description rather than conflating plant capacity, waste supply and carbon credits.
- Edmonton Chamber: City Budget Bulletin #2, Waste Management20 August 2018. Contemporary account of the 2008 commercial entry, $6.2M losses since 2012, private-hauler processing access and the call for a change of course. The Chamber’s account is read alongside the City’s later non-regulated waste strategy.
- 2018 Utility Rate Filing, Appendix CPrinted page 59: structural investigations, snow-load assessments, safety closure and financial implications. This is the City’s account of engineering advice, not the underlying engineering report.
- Henderson, Dhar and Naeth: Reclamation of Hydrocarbon Contaminated Soils Using Soil Amendments and Native Plant SpeciesResources, 2023, 12(11), 130. University of Alberta authors; pages 3 and 7 on Edmonton compost sourcing and elevated salts/metals, with beneficial reclamation results. A specific experiment, not a historical plant-wide compliance or marketability assessment. Open access, CC BY 4.0.
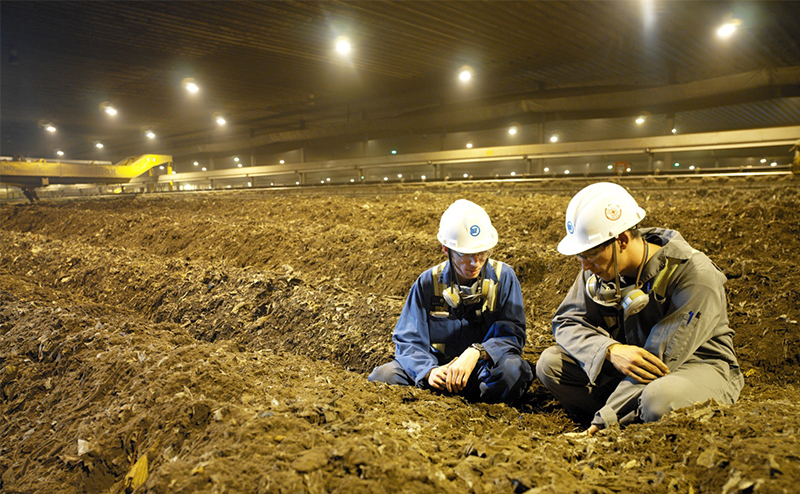
- City photograph: composting facility interiorSource photograph reproduced to identify the facility and process. It does not establish the composition of the material shown.
- Utility Committee minutes, 25 June 2021Items 6.9 and 6.10: C. LaBossiere, Alberta Waste Management Association, listed among speakers. This records wider waste-policy participation, not a commercial-exit decision.
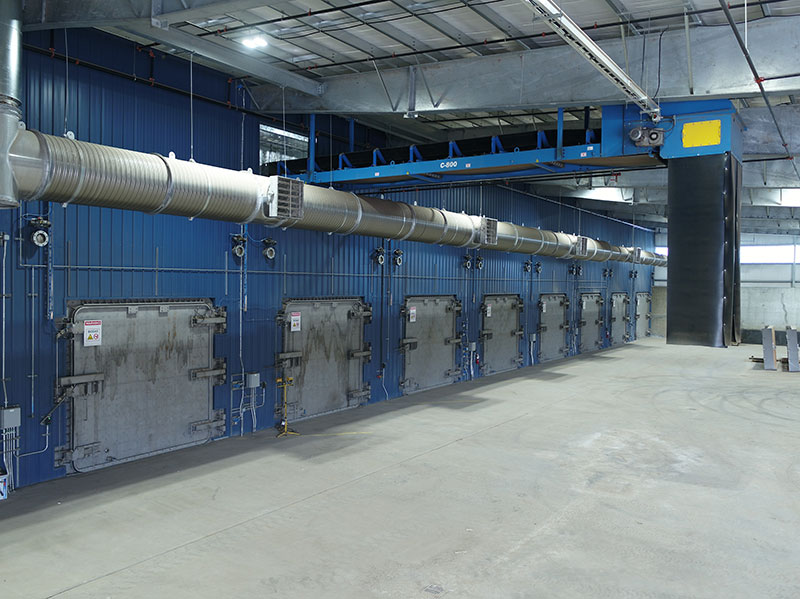
- City photograph: anaerobic digestion chambersOriginal image accompanying the City’s organics-processing material. Separate from the historical co-composter.
- City Manager Simon Farbrother’s article, 26 July 2012Published by Canada West Foundation. Contemporary City-authored account linking diversion claims, processing partnerships, commercial services and China export opportunities. Targets are not achieved outcomes.
- Global News, 4 June 2014Contemporary biofuels headline, transcribed above.
- Global News, 12 May 2015Contemporary composter headline, transcribed above.
- Global News, 1 February 2018Audit coverage headline; subsequently updated 5 February.
- Global News / 630 CHED, 28 December 2018International venture headline, transcribed above.
- Guidotti and Abercrombie: Aurum, a case study in the politics of NIMBYWaste Management & Research, 2008. Abstract documents the 1989–1990 proposal and successful opposition. Does not establish the alleged land-deal fraud.
- The Edmonton Waste-to-Biofuels Project: From Research to RealityRCA conference, 2 October 2014. Slides 5–6 identify the co-composter and Materials Recovery Facility photographs.
- Lisa Brown, City of Edmonton: Electronic Odour Monitoring2015 CPANS conference. Slide 6 maps the landfill, composting hall, IPTF and biosolids lagoons.
- City Materials Recovery Facility lease listingUpdated 20 March 2025. Page 3 provides an aerial footprint of the MRF; used to check its location, not to infer a completed lease.
- Opening of Edmonton’s mixed C&D recycling facilityContemporary March 2012 report: $4.3M cost. This amount is not evidence of a $4.3M loss.
- City recycling guidance: resin codes and material marketsCurrent public explanation checked 8 October 2026. Acceptance depends on sorting, sale and transport; it does not verify historical stockpile outcomes.
- City Program Action Plan, report CR_5829, attachment 4Pages 3–6: non-regulated business objectives and outcomes; p. 5: $6.2M cumulative losses, including a $2.4M C&D inventory-value adjustment. Broader program, not commercial collection alone.
- Waste Management Branch, 2010 utility budgetPrinted p. 36: $4.3M construction/demolition facility budget financed through self-liquidating debentures. The adjacent provincial-grant entry concerns the separate biofuels research facility.
- ERA: Heartland engineering studyStudy funding, lower-than-expected fuel energy content, underestimated capture energy demand, 25% scale-up and commercial-model changes.
- Varme: Industrial Heartland projectAccessed 8 October 2026: 205,000 tonnes per year, under development, anticipated 2026 final investment decision.
- Varme final outcomes report to ERA, submitted May 2025Pages 5–6 and 11: 180 km versus 90 km round trips; detailed emissions calculations developed separately. Project-authored report.
- Claystone business plan in Beaver County recordsSearch “largest customer”, “long-haul” and “53-foot”. Describes Edmonton service and bundled transport strategy; no current Edmonton bid price identified.
- Claystone: Strathcona County contract, September 2022Competitive RFP selection for service commencing January 2023. Announcement does not disclose the negotiated fee.
- WMI v. Edmonton, 1996 ABCA 88 — Expropriation Law Centre digestPublished case digest dates the bylaw amendment to 1995 and describes termination of private contracts. Full reasons were not available in the accessible digest.
- Supreme Court of Canada — WMI v. City of Edmonton, file 25246Official docket: leave to appeal dismissed with costs on 15 August 1996; no full Supreme Court appeal.
- Toronto: Etobicoke collection contract award, 5 October 2021Scope p. 1; household count p. 4; annual bids p. 5. Normalized monthly equivalents calculated from annual bids ÷ 65,711 ÷ 12. Non-compliant bid excluded.
- Nanton 2024 Annual Report — audited financial statementsNote 18(iii): fixed monthly collection charges $2,687 and $2,742; variable fees $2.93 and $2.99 per household. Contract scheduled to expire August 2025.
- Kamloops: 2026 collection ratesMulti-Family Containers section: garbage rental includes weekly tip; recycling weekly rate. These differ from the commercial tariff on the same page.
- Edmonton: 2026 waste utility ratesCurrent customer charges: $42.63 for standard 240-litre curbside cart; $27.08 per apartment or condo dwelling. EPR funding reduces resident charges.
- Edmonton v. TransAlta, 2008 ABQB 426 — published court headnoteEquipment-repair claim of approximately $2.5M; negotiated sale terms; notice requirements; dismissal upheld. Separate from the later roof and building failure.
- Robertson v. Edmonton (1990), 104 A.R. 374 — published court headnoteAurum rezoning challenge: bylaws quashed on 29 March 1990.
- CBC archive catalogue: Aurum coverageIndexed description records Council voting to buy the site for $8.4M. Catalogue description, not a final accounting of acquisition, recoveries or loss.
- City report 2000PWW044, 13 April 2000 — archived transcriptionResponses to councillors on financing waste management. Attachment pp. 1, 8 and 11: landfill market, City-administered multifamily contracts and commercial recycling. Third-party copy of the City report.
- City of Edmonton: Apartment and Condo CollectionPublished rollout commitment: all apartments and condos to receive food scraps and recycling collection by the end of 2027.
- Blatchford Renewable Energy — public visionCity utility’s stated ambition to inspire other cities; renewable-energy and carbon-neutral vision.
- City Auditor: Blatchford Development Performance Management Audit, 28 March 2024Audit of performance management, not a final verdict on development success. Budget p. 9; completion forecast and unsupported assumptions pp. 13–14; overall findings p. 3. Findings are dated to this audit.
- City of Edmonton: Blatchford 2025 stats and facts, 9 December 2025City’s developer role, financing explanation and nearly 400 units completed or under construction. Planning-stage land is not completed housing.
- Taproot Edmonton: Blatchford utility’s financial sustainability, 11 February 2026Reporting and interview with the utility manager: original $98M non-refundable contribution requirement; approximately $69M at the time of reporting; grant assumptions and separate repayable City loans.
- Blatchford Renewable Energy: 2026 rates, 4 December 2025Official rate freeze and planned review of financial sustainability following federal policy changes.
- Toronto Auditor General: District 2 Curbside Collection Contract, 6 February 2014Appendix 1, pp. 8–9 and Exhibit 1 (printed p. 20): first-year and recurring savings, retained monitoring costs and diversion finding. 35.4% calculated as $10.8M ÷ $30.5M. Historical collection comparison, not full-system privatization.
- Toronto Auditor General: Waste contract management, 24 June 2026Recommendations on performance monitoring, accountability mechanisms, supplier evaluation, payments and change-order controls.
- GFL 2020 offering prospectus — company historyFounded in 2007; Toronto award identified as a landmark contract; expansion through acquisitions and organic growth. Company disclosure.
- GFL: $5.125-billion recapitalization announcement, 23 April 2018Announced transaction’s implied enterprise value, not profit or value attributable to Toronto; more than 5,000 employees reported.
- City of Edmonton: Michael Recycle’s Fun Book, September 2015 editionCover reproduced for discussion of the City’s public education and branding. Illustration and publication: City of Edmonton.
- City of Edmonton: Waste Education ProgramsTour and classroom photographs reproduced from the City’s program materials; capture dates unspecified. Credits: City of Edmonton. Programs include EWMC tours and school presentations.
- City of Edmonton: EWMC Photographic Tour, May 2015 — historical documentSearch-indexed text describes a teaching theatre, classrooms and meeting rooms. Original document address currently redirects to a missing-page notice. No separate theatre construction cost is asserted here.
- City of Edmonton: Integrated Processing and Transfer FacilityRefuse-derived-fuel photograph reproduced from City materials for critical discussion of the processing narrative. Credit: City of Edmonton; photograph date unspecified.
- Toronto: Waste transport contract award, 27 May 20192021 estimated prices divided by estimated tonnages: Contract A $8,135,437 / 282,708; Contract B $6,722,081 / 222,512. Totals with allowances $9,148,981 and $7,594,290. Haulage only; payload specifications p. 5.
- Edmonton Open Data: Residential Waste Material Movement at EWMCPublic dashboard for tracing material flows. A complete annual reconciliation by landfill destination and associated realized revenues is still the requested disclosure.
Records residents should ask the City to publish
A complete comparable diversion series and capital ledger since 1990; total net loss after recoveries and asset reuse; current contractor penalty schedules and deductions; equivalent internal service consequences; contemporary route productivity; a full allocation of curbside costs; actual all-inclusive contractor bids; a current regional disposal-capacity inventory; and the Varme contract’s price, minimum-volume, shortfall-payment and failure provisions.
For collection oversight, request the contracts, inspection records and performance consequences for both City crews and private contractors. For stored recycling, request inventory and final-destination records.